


Chicago sees thousands of car accidents every year, resulting in injuries, fatalities, and significant financial losses for drivers and families. Understanding the latest Chicago car accident statistics can reveal where crashes happen most often, what causes them, and who is most at risk. Below, we break down key crash data and trends to provide a clearer picture of roadway safety across the city.
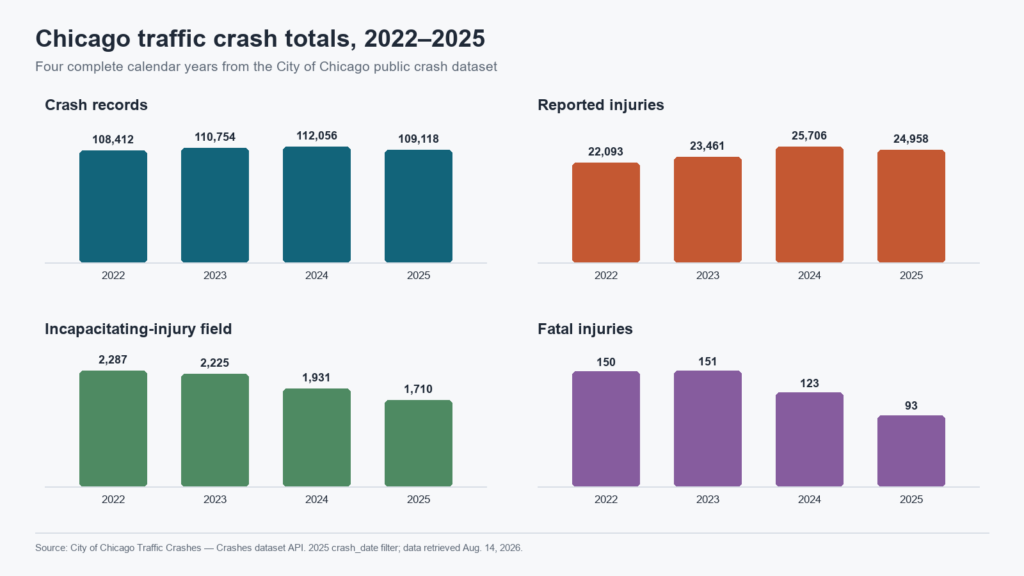
Chicago recorded 109,118 traffic crashes and 24,958 reported injuries in 2025, according to the City of Chicago’s public crash dataset. That averages about 299 crash records and 68 reported injuries per day.
Chicago accident statistics at a glance
– 109,118 traffic crash records
– 24,958 reported injuries
– 1,710 injuries in the dataset’s incapacitating-injury field
– 93 fatal injuries
– 299 crash records per day
The injuries you suffer in a car accident can disable you and threaten your long-term health. They can traumatize you mentally and cost you thousands of dollars in medical expenses and lost wages.
How Common Are Car Accidents in Chicago, IL?
Chicago provides car crash data using a Traffic Crash Dashboard. This dashboard uses crash reports from both driver self-reports and Chicago Police Department accident reports. It does not include information from the Illinois State Police. As a result, the dashboard does not include crashes on interstate highways and highway ramps.
Chicago’s public data contains more than 100,000 traffic crash records in each of the last four complete calendar years. The dataset recorded 109,118 crashes in 2025, or roughly 299 per day.
| Year | Crash Records | Reported Injuries | Incapacitating Injuries | Fatal Injuries |
| 2022 | 108,412 | 22,093 | 2,287 | 150 |
| 2023 | 110,754 | 23,461 | 2,225 | 151 |
| 2024 | 112,056 | 25,706 | 1,931 | 123 |
| 2025 | 109,118 | 24,958 | 1,710 | 93 |
Based on Chicago’s population of 2.7 million, it has a relatively high number of crashes compared to other large cities. For example, Houston has 2.3 million people but only had approximately 109,118 car accidents in 2025
When Are Car Accidents Most Common in Chicago?
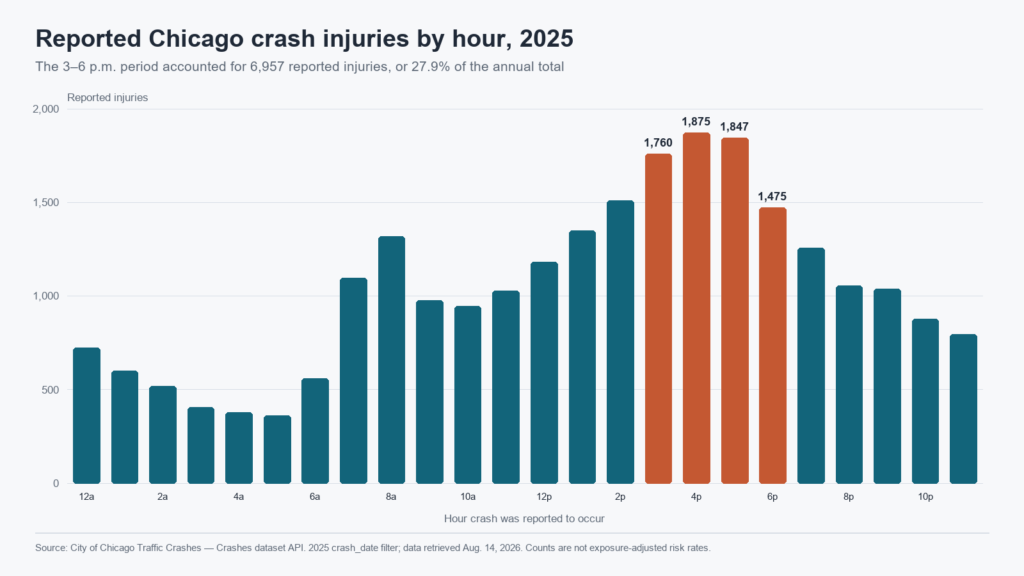
In 2025, the greatest number of Chicago crash records occurred during the afternoon commute. The 3 p.m. hour had the most crash records, while the 4 p.m. hour had the most reported injuries.
| Hour crash was reported to occur | Crash records | Reported injuries |
| 3 p.m. | 8,688 | 1,760 |
| 4 p.m | 8,435 | 6,957 |
| 5 p.m. | 7,867 | 6,957 |
| 6 p.m | 6,289 | 6,957 |
| 3–6 p.m. total | 31,279 | 6,957 |
Together, the 3 p.m. through 6 p.m. hours accounted for 28.7% of crash records and 27.9% of reported injuries in 2025.
These are raw counts, not risk rates. The dataset does not show how many vehicles, pedestrians, or cyclists were exposed during each hour, so it cannot establish that a person was more likely to crash at 3 p.m. than at another time.
Do Most Chicago Crashes Happen in Bad Weather
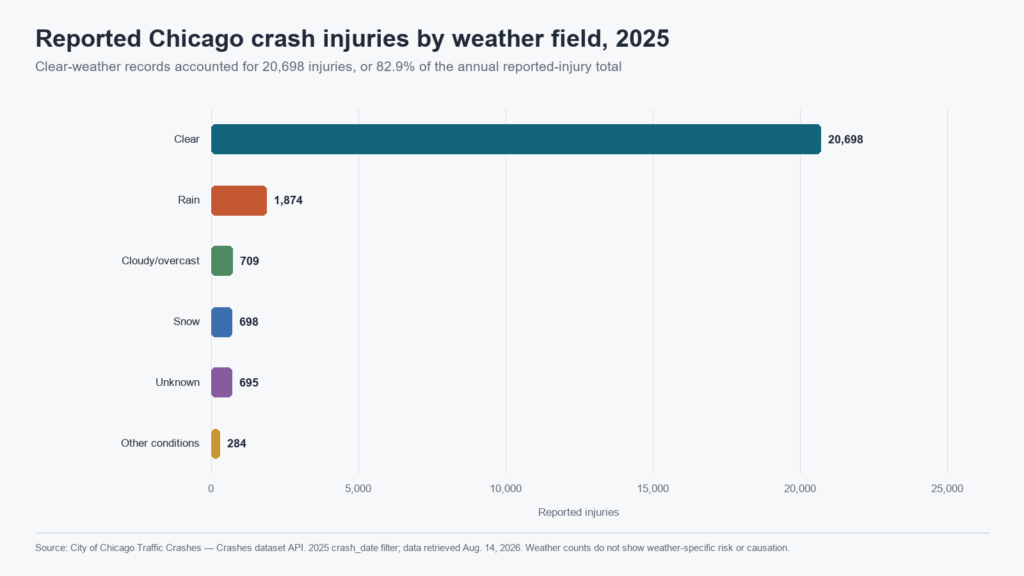
No. Most 2025 Chicago crash records were coded as occurring in clear weather
| Crash records weather | Reported | injuries |
| Clear | 85,719 | 20,698 |
| Unknown | 8,842 | 695 |
| Rain | 6,575 | 1,874 |
| Snow | 3,559 | 698 |
| Cloudy/overcast | 3,064 | 709 |
Clear-weather records accounted for 78.6% of all crash records and 82.9% of reported injuries. This does not mean clear weather causes crashes or that clear conditions are more dangerous than rain or snow.
Chicago has many more clear-weather driving hours, and the public dataset does not include the traffic-exposure information needed to calculate a weather-specific crash rate.
Weather is also recorded from the best information available when the report is prepared. It is one part of a crash record, not a legal conclusion about what caused the collision.
What Were the Most Common Types of Chicago Crashes?
The City dataset uses a field called **first crash type** to describe the first harmful event in the crash. The five largest categories by number of 2025 records were:
| First crash type | Crash records | Reported injuries |
| Parked motor vehicle | 24,528 | 1,233 |
| Rear end | 21,285 | 4,854 |
| Sideswipe, same direction | 18,554 | 1,589 |
| Turning | 16,223 | 4,902 |
| Angle | 11,594 | 5,146 |
The most frequent category did not produce the most reported injuries. Crashes involving a parked motor vehicle led the record count, while angle crashes produced the largest reported-injury total among the first-crash-type categories. Turning and rear-end crashes were close behind.
These categories describe the event; they do not identify who was at fault. A rear-end, turning, sideswipe, or angle collision can involve different traffic controls, lines of sight, vehicle movements, witness accounts, and disputed versions of what happened.
Learn more about rear-end crash claims and intersection crashes
What Does Chicago Crash Data Say About Reported Causes?
The dataset includes a **primary contributory cause** field based on the report. In 2025, “unable to determine” was entered for 45,040 crashes—41.3% of all records. Among the specific reported causes, failing to yield the right-of-way appeared most often and was associated with the largest number of reported injuries.
| Primary contributory-cause field | Crash records | Reported injuries |
| Unable to determine | 45,040 | 7,342 |
| Failing to yield right-of-way | 12,859 | 5,294 |
| Following too closely | 9,803 | 1,858 |
| Failing to reduce speed to avoid a crash | 4,408 | 1,748 |
| Improper turning/no signal | 3,739 | 1,097 |
| Disregarding traffic signals | 2,060 | 1,612 |
The primary-cause field is descriptive. It is not a judicial finding, an insurer’s final liability decision, or proof of negligence. A reporting officer may not have access to every witness, recording, vehicle record, or other piece of evidence when the report is completed. The City also notes that some report fields may be amended later.
That is one reason an individual crash investigation matters. Relevant evidence may include photographs, video, witness statements, vehicle damage, traffic controls, phone or app information when lawfully available, medical records, and testimony.
What Do the Statistics Show About Pedestrian and Bicycle Crashes?
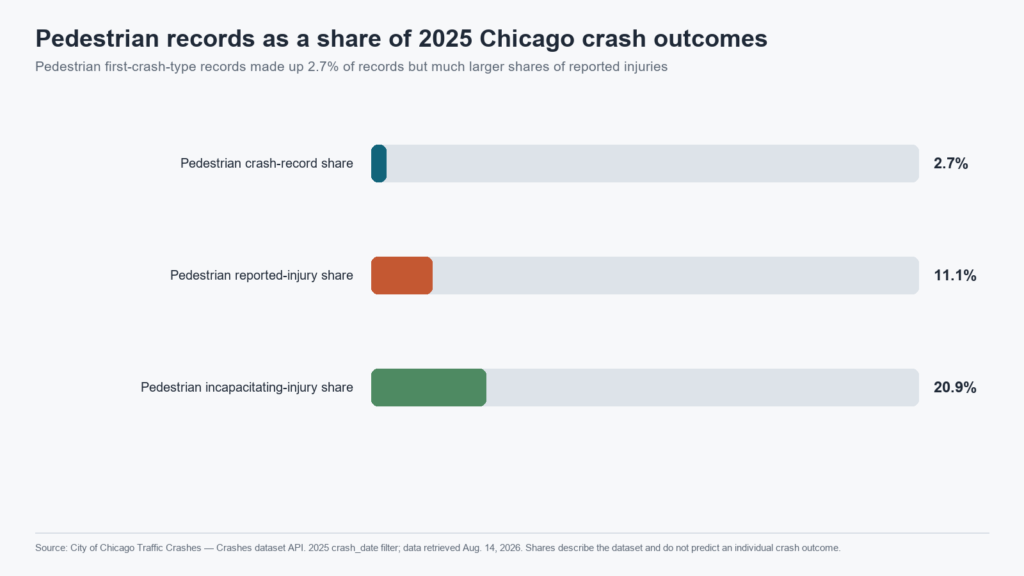
People outside a vehicle represented a relatively small share of Chicago crash records but a much larger share of reported injuries.
| First crash type | Crash records | Reported injuries | Incapacitating-injury field | Fatal injuries |
| Pedestrian | 2,918 | 2,772 | 358 | 30 |
| Pedalcyclist | 2,466 | 1,837 | 179 | 2 |
Pedestrian first-crash-type records represented 2.7% of all 2025 crash records, but 11.1% of reported injuries and 20.9% of injuries in the incapacitating-injury field**.
These figures describe the dataset and should not be used to predict an individual outcome. If you or a family member was struck while walking, learn how a Chicago pedestrian accident lawyer may evaluate the evidence and available insurance.
Where Do Car Accidents Most Often Occur in Chicago?
The City dataset includes street names and map coordinates, but a simple list of streets with the most crash reports does not identify the most dangerous road.
Longer streets and roads carrying more traffic will often accumulate more crashes. A fair comparison may require defined street segments, traffic volume, roadway length, the number of intersections, the mix of road users, and the time period studied. Without those denominators, a raw street total measures volume—not the chance that any one trip will end in a crash.
For location-specific context, visit our guide to Chicago’s most dangerous roads and intersections. Rankings should always be read together with their date range, geography, source, and method.
How Do Chicago Numbers Compare With Illinois Crash Statistics?
The latest complete statewide Crash Facts report available from the Illinois Department of Transportation covers 2024. IDOT reported:
– 303,913 motor-vehicle crashes in Illinois;
– 63,109 injury crashes; and
– 1,085 fatal crashes.
These statewide figures should not be directly subtracted from or divided into the Chicago totals on this page. The City and IDOT sources have different geographic scopes, reporting systems, update schedules, and definitions. Use the 2024 Illinois Crash Facts report for statewide analysis and the City dataset for the Chicago-specific figures discussed here.
What Chicago Crash Statistics Cannot Tell You About Your Case
Public statistics can describe patterns across thousands of crashes. They cannot determine:
– how your collision happened;
– whether one or more people or businesses may be legally responsible;
– whether you share any responsibility;
– what photographs, video, witnesses, or vehicle evidence may still exist;
– whether the crash caused a particular injury;
– which insurance policies or limits apply;
– the cost of past or future medical care and lost income; or
– whether a settlement offer accounts for the documented losses.
Those questions require case-specific evidence. If you are assessing what to do next, read our guide to the Illinois car accident claim process.
About This Data and Methodology
This page analyzes the City of Chicago Traffic Crashes — Crashes dataset through its public API.
Date range
The 2025 analysis includes records with a crash date on or after January 1, 2025, and before January 1, 2026. The multi-year table groups records by calendar year.
Measures
– **Crash records** count dataset rows. The City identifies each row as one traffic crash.
– **Reported injuries** sum the dataset’s total-injury field across crash records.
– **Incapacitating injuries** and **fatal injuries** sum the corresponding public data fields.
– Time, weather, first crash type, and primary contributory cause use the values recorded in those fields.
– Percentages are calculated from the unrounded 2025 totals.
Scope and limitations
The City says the dataset covers crashes within Chicago city limits and under Chicago Police Department jurisdiction. It typically excludes crashes on interstate highways, freeway ramps, and boundary roads when another agency—not CPD—handled the report.
The City also explains that roughly half of its crash reports, mostly minor crashes, are self-reported at a police district and the other half are recorded at the scene by a responding officer. Weather, road, speed-limit, cause, and other fields reflect the best available information at the time and may not match later assessments. Records can be added or amended after the crash date.
The time, weather, type, and cause comparisons on this page are raw counts. They are not exposure-adjusted risk rates and do not establish causation or legal fault.
Source
[City of Chicago Traffic Crashes — Crashes]
**Data retrieved:** August 14, 2026
Frequently Asked Questions About Chicago Car Accident Statistics
How many car accidents happen in Chicago each day?
The City dataset recorded 109,118 traffic crashes in 2025. Spread across 365 days, that is an average of about 299 crash records per day. The daily number varies, and the dataset covers more than passenger-car collisions.
How many people were injured in Chicago crashes in 2025?
Chicago’s crash dataset recorded 24,958 reported injuries in 2025, including 1,710 injuries in the incapacitating-injury field and 93 fatal injuries.
When are car accidents most common in Chicago?
The 3 p.m. hour had the most 2025 crash records, while the 4 p.m. hour had the most reported injuries. The 3–6 p.m. period accounted for 28.7% of crash records and 27.9% of reported injuries. These are raw counts, not per-trip risk rates.
What was the most common type of Chicago crash?
A collision involving a parked motor vehicle was the most common first-crash-type category in 2025, with 24,528 records. Rear-end crashes were next, with 21,285. Angle crashes produced the most reported injuries among the first-crash-type categories, with 5,146.
What was the most commonly reported specific cause?
Failing to yield the right-of-way was the most frequently entered specific primary contributory cause in 2025, appearing in 12,859 crash records. However, the field said “unable to determine” in 45,040 records, and the report field does not establish legal fault.
Does the Chicago dataset include interstate crashes?
Generally, no. The City says crashes for which CPD was not the responding agency—typically crashes on interstate highways, freeway ramps, and certain boundary roads—are excluded.
Are these the final 2025 numbers?
They are the totals returned by the City dataset on August 14, 2026. The City may revise historical totals when reports are finalized or amended, so later queries can produce slightly different figures.
Can Chicago accident statistics prove who was at fault?
No. Statistics describe patterns across many crashes. Fault in an individual collision depends on the applicable law and evidence specific to that event.
Injured in a Chicago Car Accident? Get a Case-Specific Review
Statistics cannot tell you what evidence exists in your case, which insurance may apply, or whether an offer reflects your documented losses. Attorneys of Chicago can review the basic facts, explain whether the firm may be able to help, and identify appropriate next steps.
Schedule a Free Consultation With Our Chicago Car Crash Lawyer
Chicago has a lot of car accidents, and these crashes can cause expensive and disabling injuries. To discuss the compensation you can seek for your car accident injuries, contact Attorneys of Chicago Personal Injury Lawyers for a consultation. Our trusted Chicago car accident attorneys are here to help.
Visit Our Personal Injury Law Office in Chicago, IL
Attorneys of Chicago Personal Injury Lawyers
Address:
134 N La Salle St #2160
Chicago, IL 60602
Phone:
(312) 766-4878
Business Hours:
Monday: Open 24 hours
Tuesday: Open 24 hours
Wednesday: Open 24 hours
Thursday: Open 24 hours
Friday: Open 24 hours
Saturday: Open 24 hours
Sunday: Open 24 hours

Our legal team handles all types of car accidents, including:
- DUI Accidents
- Head-On Crashes
- Highway Crashes
- I-90 Accidents
- Left-Turn Accidents
- Multi-vehicle Car Crashes
- Parking Lot Accidents
- Red and Yellow Light Crashes
- Rollover Accident
- Uninsured Motorist Claims
- U-Turn Accidents
Additional Car Accident Articles & Information
- Can I Be Compensated for Pre-Existing Conditions After a Car Accident?
- Can I Be Reimbursed for Lost Wages After a Car Accident?
- Chicago, IL Car Accident FAQs
- Child Car Seat Laws
- Common Car Accident Scenarios in Chicago — Causes & Determining Fault
- Illinois Car Accident Claim Process
- Illinois Car Inspection Laws
- Most Dangerous Roads/Intersections in Chicago
- Who Is at Fault for My Chicago Car Accident?
- Who Will Pay My Medical Bills After a Car Accident?
